Funding Rate Analysis for Futures Traders
Funding Rate Tells You Before the Pump Starts.
The market doesn’t reward hope. It rewards positioning.
If you're trading Binance Futures without actively tracking Funding Rate and Open Interest, you're reacting — not anticipating.
One Screen. All Funding Rate Data.
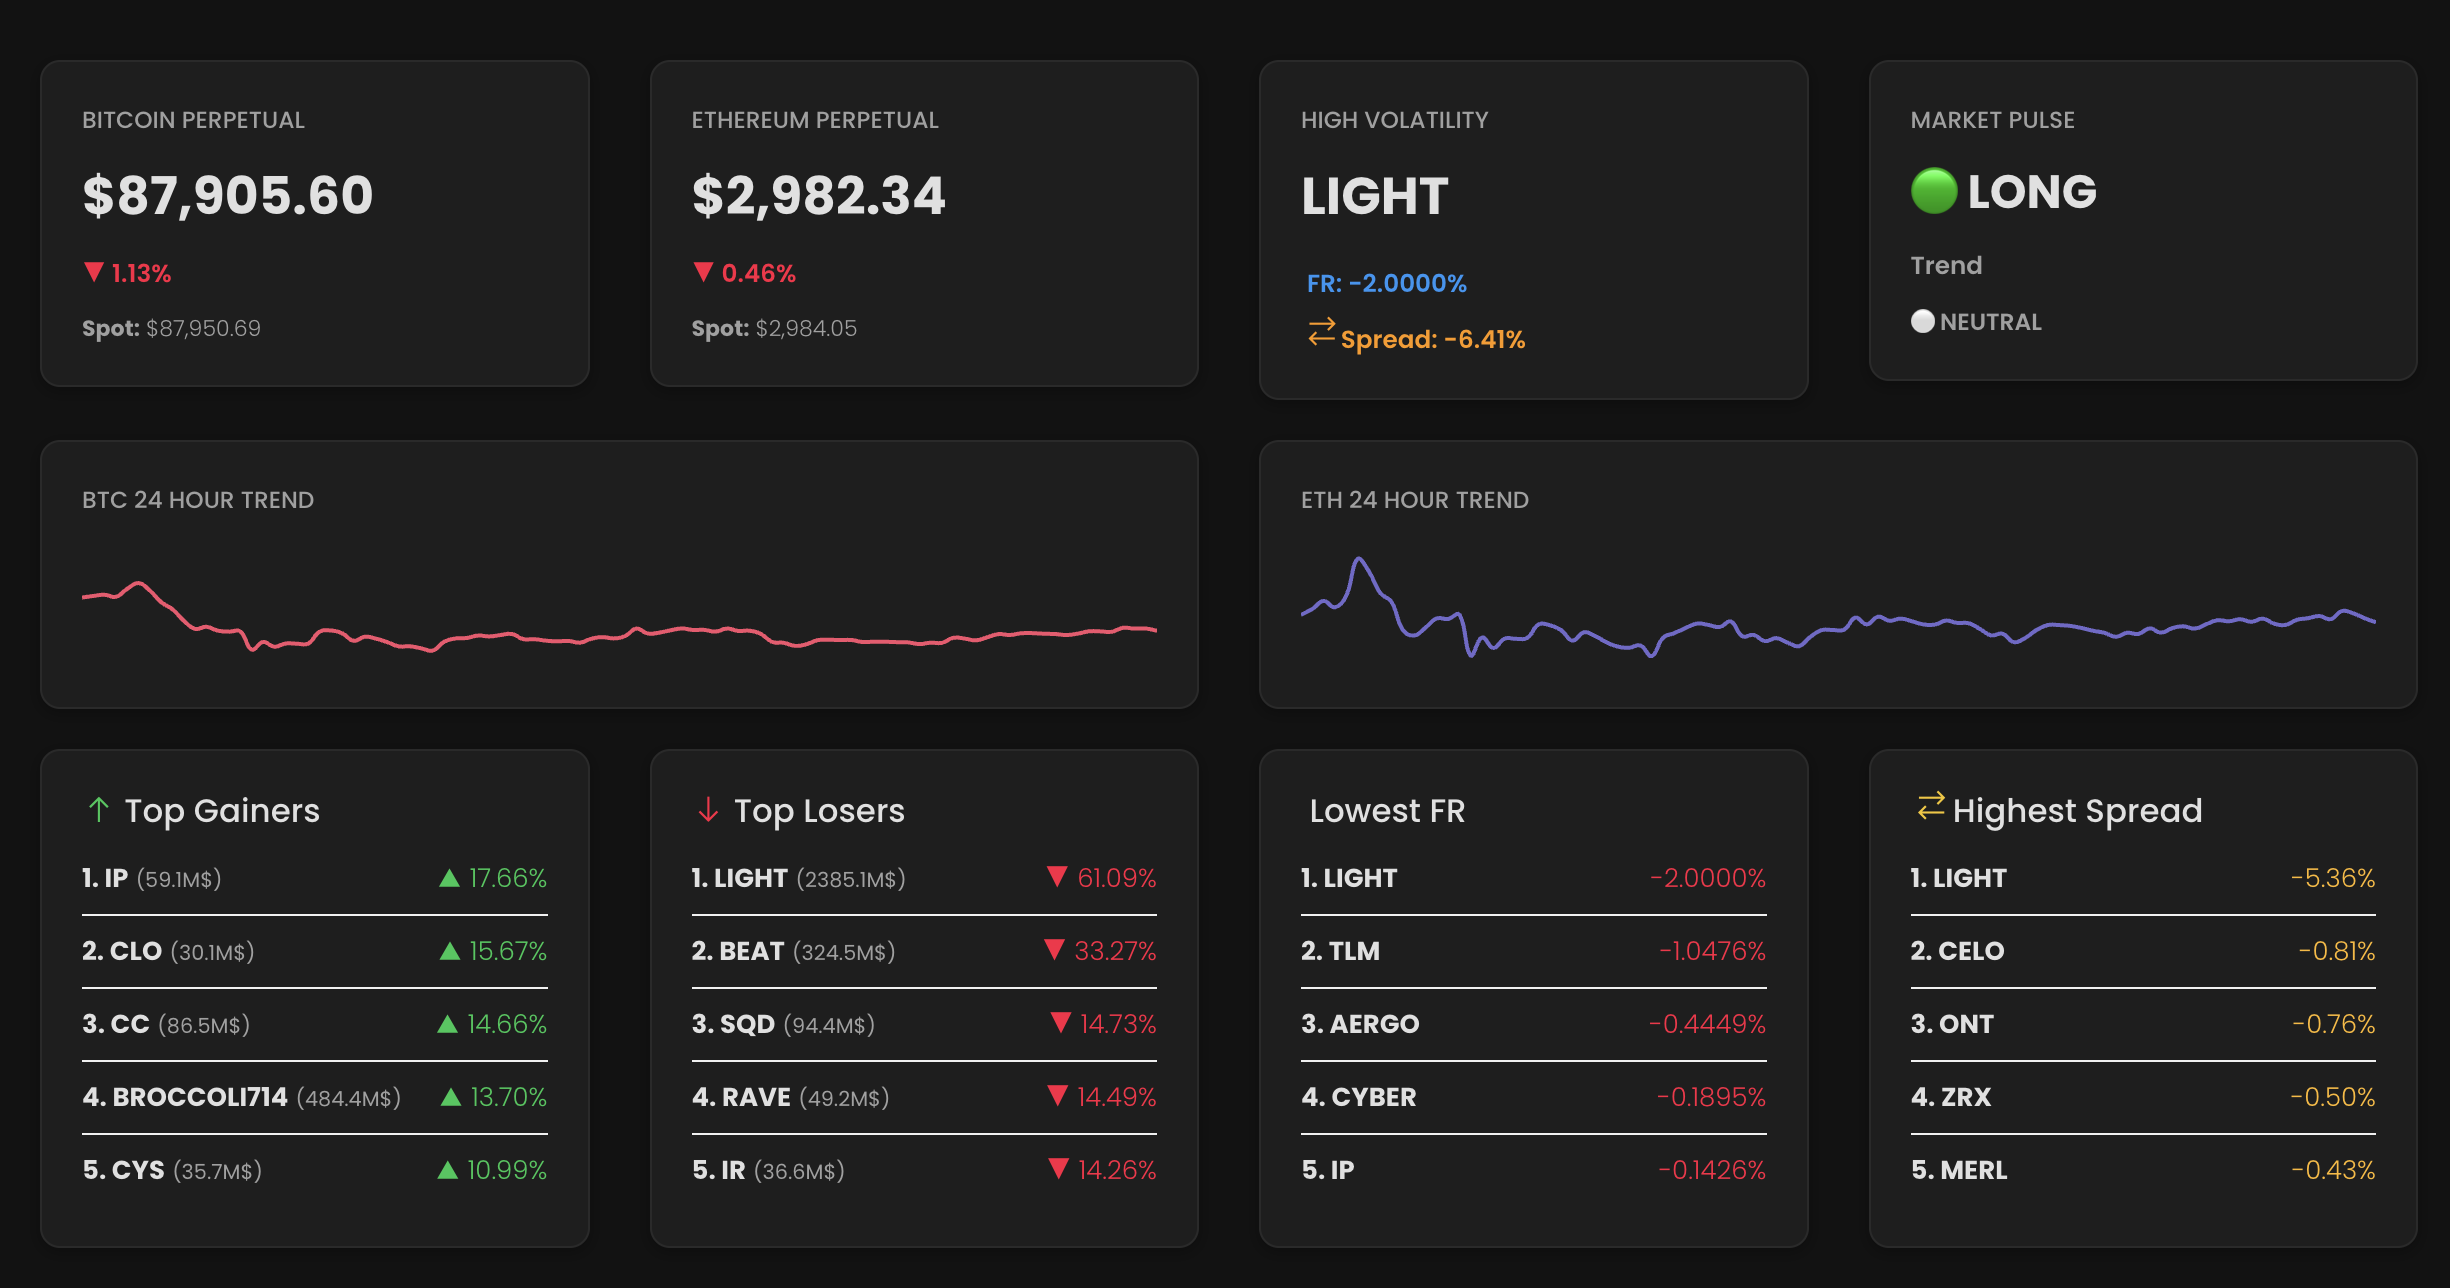
OMD Insights gives you a centralized dashboard where you can monitor Funding Rates across multiple perpetual futures markets in real time.
No switching tabs. No spreadsheets. No manual tracking.
Funding Rate values, trend direction, and structural market imbalance — displayed clearly and instantly.
Private Telegram Channel – Real-Time FR Alerts
Members are automatically added to our private Telegram group where structured market data is shared continuously.
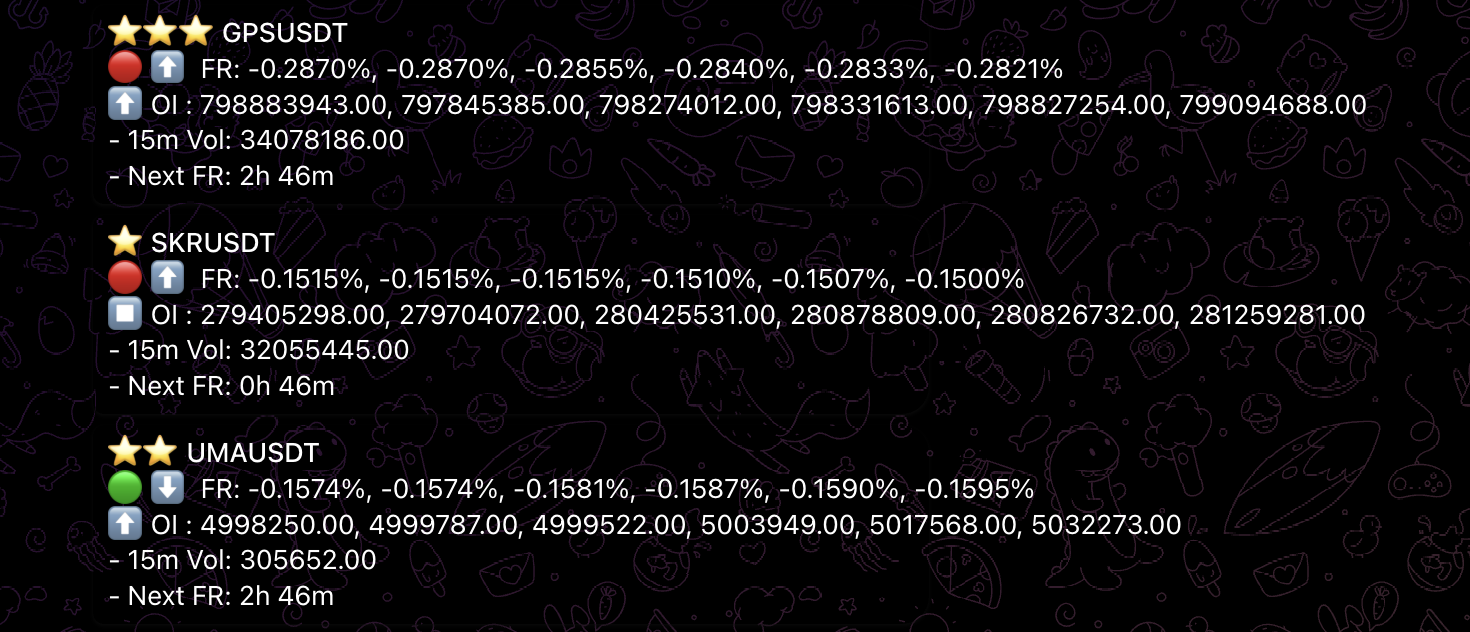
Each alert includes:
- 📊 Current Funding Rate
- 📈 Funding Rate change
- 💰 Open Interest value
- 📉 Open Interest change
- 💵 Current price
- 📦 Volume data
- ⏳ Time remaining until next Funding
Catch Pump & Dump Moves Before They Happen
Extreme negative funding? Shorts stacking. Extreme positive funding? Longs overcrowded.
Funding Rate + Open Interest shifts often signal aggressive positioning before volatility expansion.
Smart traders don’t chase candles. They read positioning.
(Insert trade result screenshots under this section)
Real Performance. Data-Driven Decisions.
Funding Rate monitoring has consistently helped identify volatility ignition points across multiple markets.
This isn’t a signal group. This is structured data intelligence.
The market doesn’t liquidate traders. Overexposure without data does.
Download the Updated TradingView Watchlist
Members can also download our regularly updated TradingView-ready coin list.
The list is filtered using Funding Rate pressure, Open Interest shifts, volume expansion, and structural positioning.
You don’t need 500 coins. You need the right ones.
The Market Has Two Types of Traders
- Those who monitor positioning
- Those who become liquidity
Your move.
Case Studies: Positioning Before Volatility Expansion
Below are real trade snapshots used to illustrate how positioning data (Funding Rate + Open Interest) can help spot volatility shifts before the move becomes obvious.
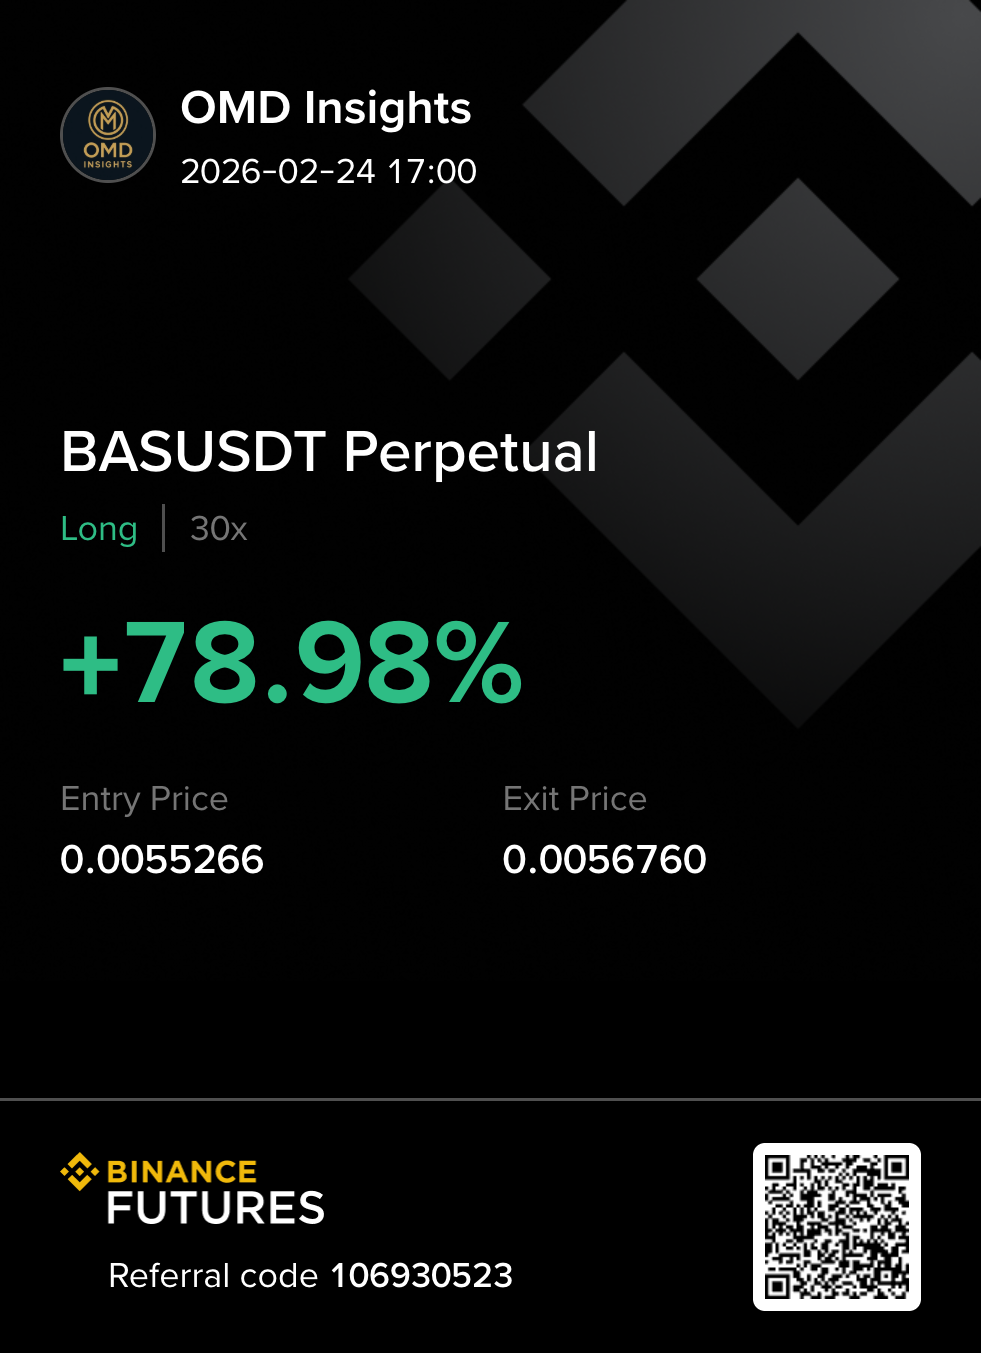
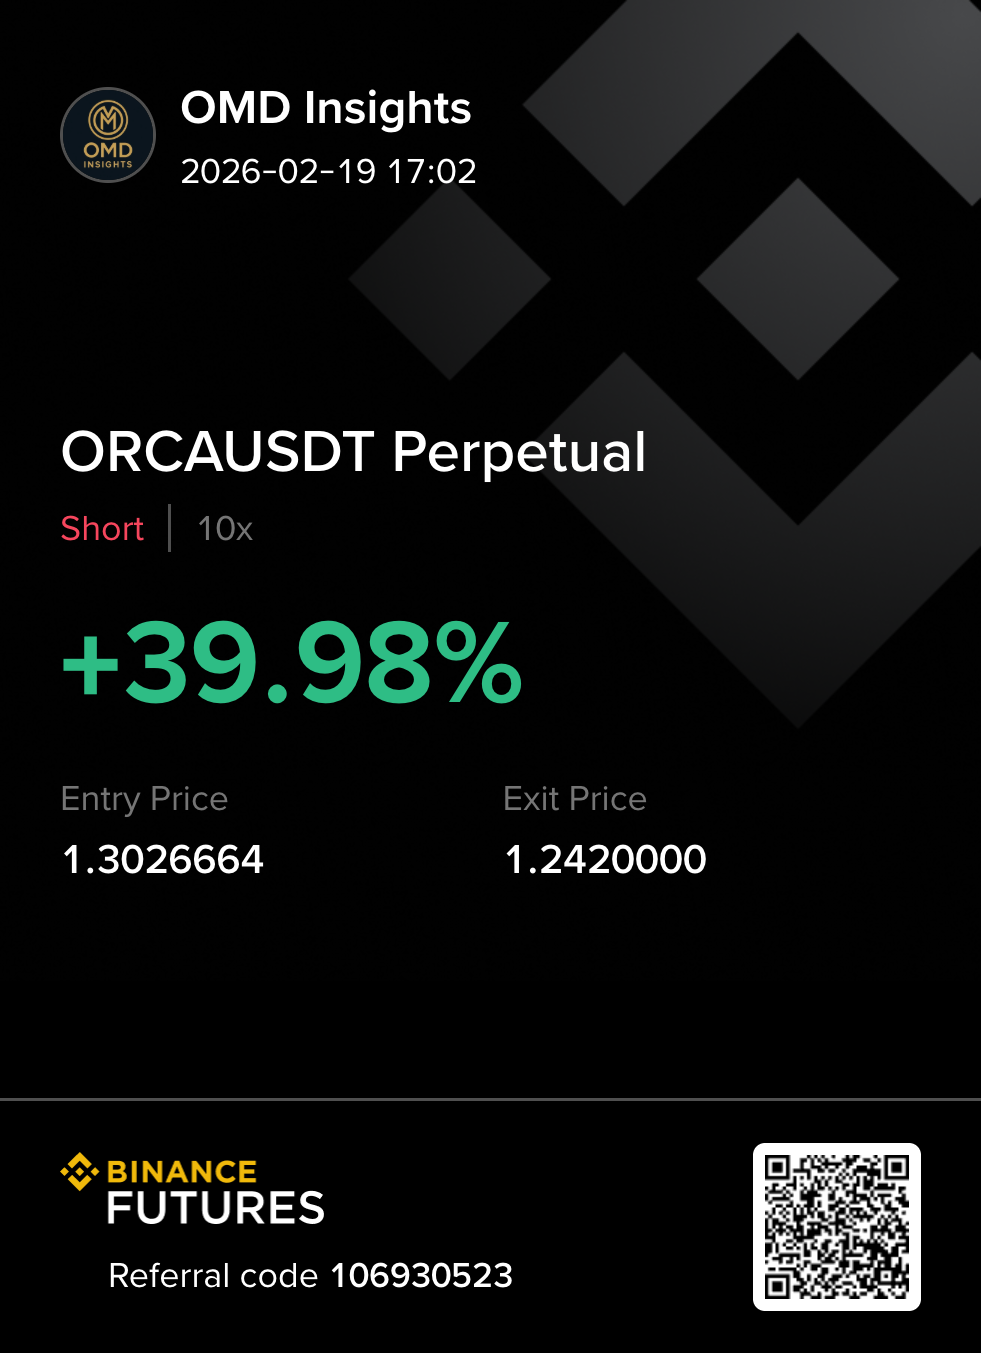
These examples illustrate how positioning data can help identify volatility shifts. Results vary based on execution and risk management.
What triggered these moves?
- Funding Rate imbalance
- Open Interest expansion
- Crowd positioning extremes
- Liquidity compression zones